The Mediterranean Pulse · Reading 4 · August 2026 · Tharro Research
The Demand That Vanished
Three readings ago we showed you the bet: airlines added 7% more seats to the Mediterranean this summer. Then we showed you the verdict so far: arrivals up at almost every large destination. Now the third instrument — the one the industry has trusted longest. It says the opposite of both.
Three readings ago we showed you the bet: airlines added 7% more seats to the Mediterranean this summer. Then we showed you the verdict so far — arrivals up at almost every large destination: Malta +18%, Greece +9.5% by air, Spain +5%, Croatia +5.9%. All of it is on the board in Reading 1.
Now the third instrument. The one the industry has trusted longest: what people type into the search box.
It says the opposite of both.
Travel search volume fell in every market
We track roughly 167,000 destination-pointing keywords across four source markets — the UK, Germany, Poland and Sweden — with four years of monthly Google history behind each one. Not brand terms, not one hero keyword per country: the full universe of searches that point at a Mediterranean destination, from “crete all inclusive” to “familienhotel algarve”.
Here is the year-over-year change, last twelve months versus the twelve before:
Search YoY
ES
GR
IT
TR
PT
MT
FR
CY
HR
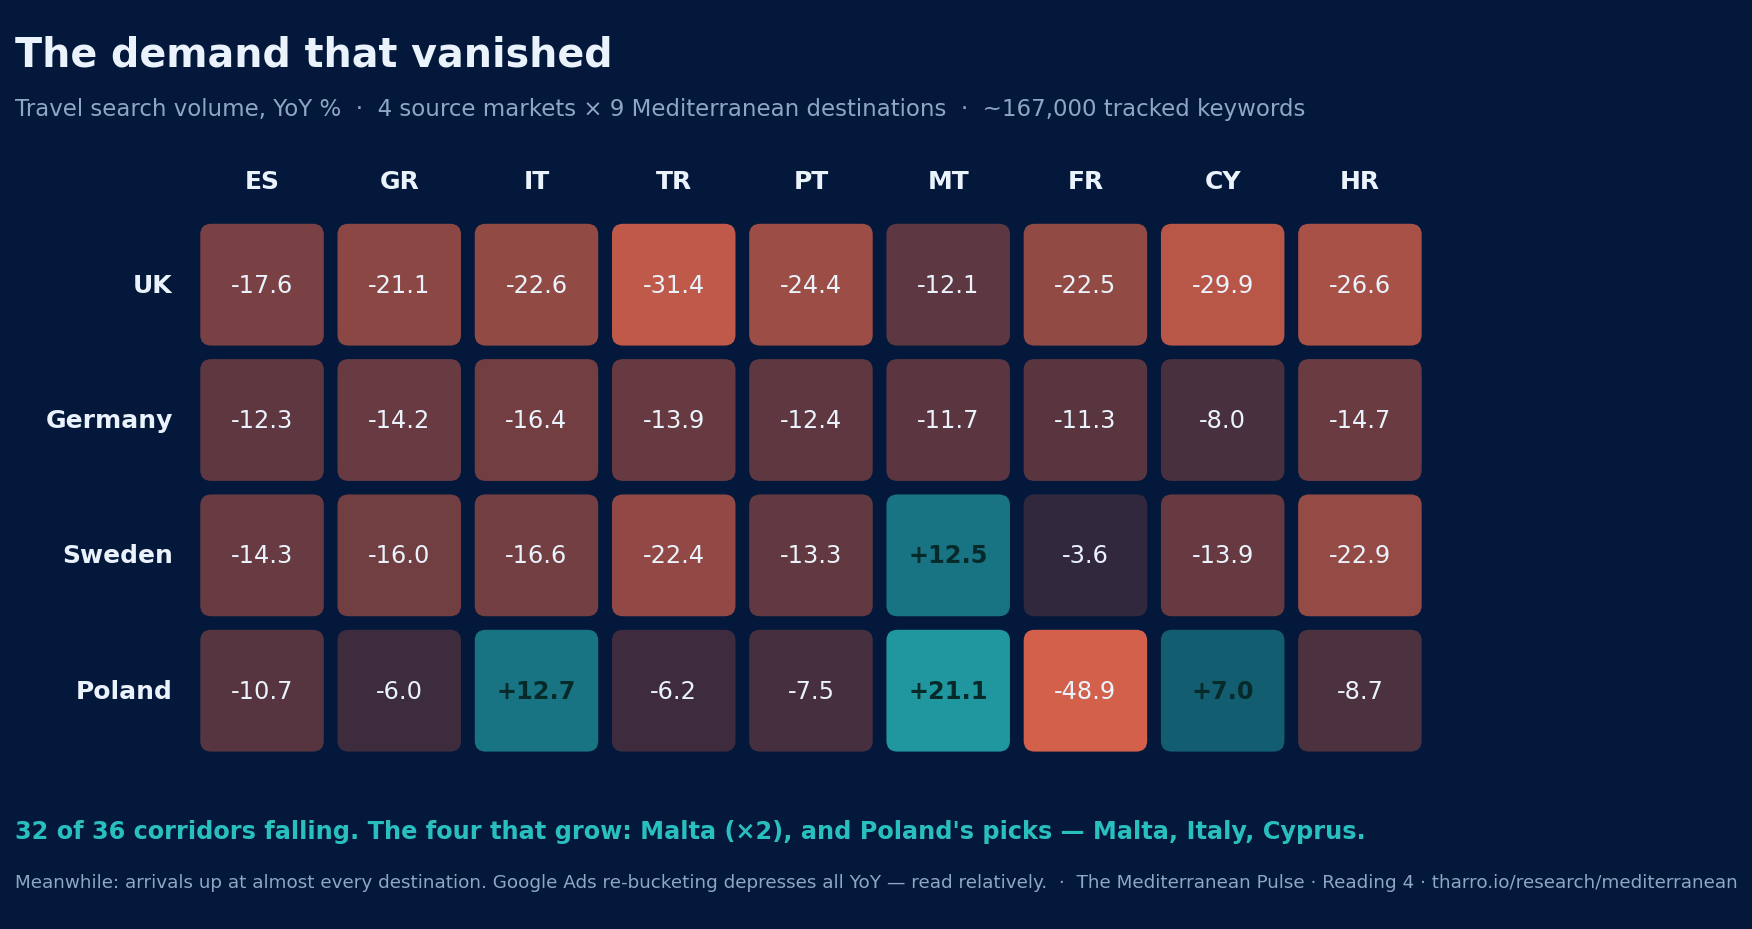
Thirty-six corridors. Thirty-two are falling. The four that grow share two names: Malta (up in both Poland and Sweden — the only destination green in two markets) and Poland (the only source market green anywhere beyond a single cell).
One honesty note before anything else: Google changed how it buckets search volume this year, which depresses every year-over-year number in this table. The absolute magnitudes are inflated downward. The relative reads — which destination falls hardest in which market, which cells defy the gravity — are what the grid is for. Read it as a ladder, not a thermometer.
Search trends vs tourist arrivals: the decoupling
Even read relatively, the grid should worry anyone still using search volume as a demand proxy. Because we now have the ground truth from Reading 1, and the two instruments have decoupled.
Put the UK row next to what UK travellers actually did this year:
UK, 2026
Search YoY
Arrivals YoY
The search box said British demand for Greece collapsed by a fifth. British arrivals in Greece rose by more than a third — the single largest reallocation of the Mediterranean summer. It said the same about Spain and Portugal; both grew.
Where the two instruments agree is the tell. Turkey and Cyprus — the two destinations actually losing British travellers — show the steepest search declines in the row. The search box still registers loss. What it can no longer register is gain.
Search has become a one-way instrument.
A collapsing search curve may mean collapsing demand, or it may mean the demand simply stopped travelling through Google on its way to the booking. A rising arrivals number with a falling search curve means the second. In 2026, the second is the normal case.
The divergence has a birthday: Q1 2025
The break has a date. For the six corridors where we hold monthly arrivals and monthly search side by side (UK, German, Polish and Swedish travel to Cyprus; UK and German travel to Greece), here is the gap between the two instruments, quarter by quarter:
Pooled, 6 corridors
24Q1
24Q2
24Q3
24Q4
25Q1
25Q2
25Q3
25Q4
26Q1
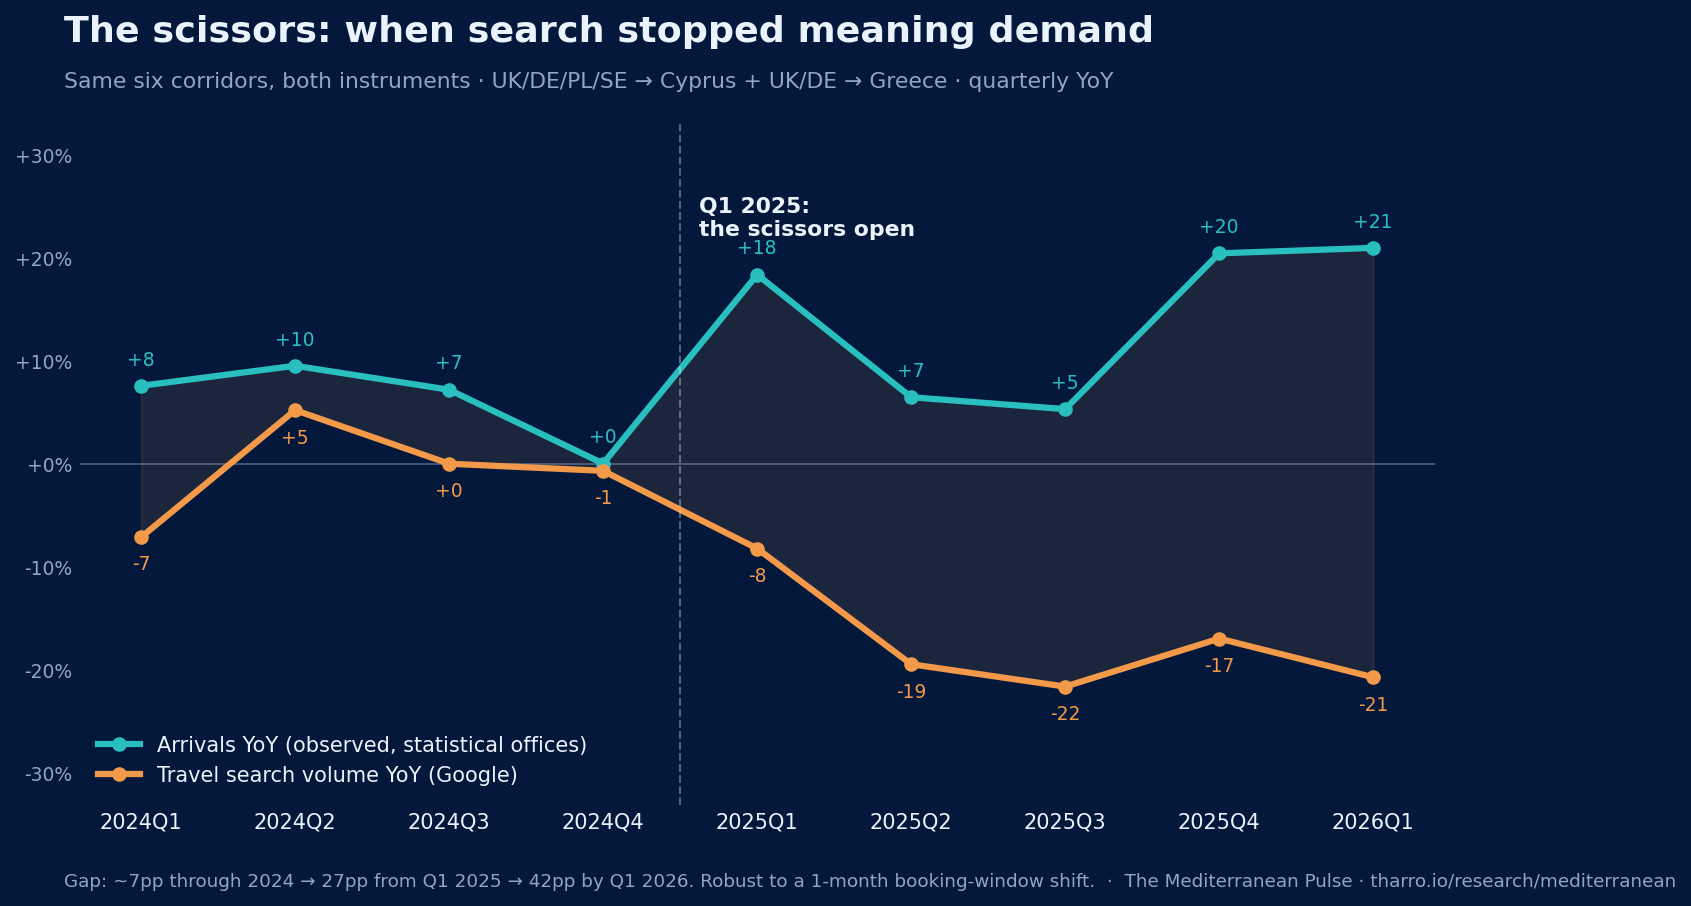
Through 2024 the two instruments told compatible stories — the gap averaged about seven points and search growth was even positive in mid-year. (The one wider 2024 quarter, Q1, is an Easter artifact: Easter fell in March in 2024 and in April in 2023; on the Easter-free January–February comparison the gap is six points, in line with the rest of the year.) In the first quarter of 2025 the scissors opened to 27 points, and they have not closed since: 42 points by Q1 2026 — and the jump is sharpest exactly where no calendar effect can explain it, between the adjacent quarters Q4 2024 (−1) and Q1 2025 (−27), and between the same seasons a year apart, Q2 2024 (−4) against Q2 2025 (−26).
Nor was the fall a one-day event. Pooled across all 36 corridors, search was still growing 9–15% through 2023, went flat and choppy through 2024, tipped negative late that year, and then slid — minus 12 in January 2025 deepening to minus 25 by June, where it has broadly stayed. A slide, not a cliff: the signature of an audience migrating channels, not of a switch being flipped.
And if the objection is that Google's own measurement changes explain the fall — they cannot explain its shape. A methodology change hits every corridor equally. Instead, the 2025 gap runs from 6 points on the Polish corridors to nearly 40 on UK–Greece — the corridor where, in 2024, British searches for Greece were growing fasterthan British arrivals. Measurement changes don't discriminate by market maturity. Behaviour does.
Search still tells you when — just not how many
One thing in the search data still works exactly as it always did: the rhythm. When searches for a destination rise, arrivals rise one month later. When searches dip, arrivals dip one month later. People search now and travel next month — and that one-month rhythm is as visible in 2025 as it was in 2023.
What no longer works is the height of the curve. The whole line has sunk: fewer people search at every point of the year, even as more of them travel.
In practice: if UK searches for your destination jump in April, expect the UK wave in May — same as always. But if this April's jump is 20% smaller than last April's, that no longer means 20% fewer Brits are coming. It usually just means fewer of them asked Google on the way. The clock still works; the gauge broke.
The four cells that grew
The exceptions are not noise. They are the same names that lead every other layer of this series.
Malta is the only destination whose searches rise in two source markets (+21.1% in Poland, +12.5% in Sweden) — the same Malta that carries +18.1% arrivals and the fastest-growing seat schedule in the set. When a destination is genuinely compounding, it still shows up everywhere, even in the dying instrument.
Poland is the only source market where the grid has more than one green cell — and, more interestingly, the only market where search still broadly agrees with reality. Polish search and Polish arrivals point the same direction on Cyprus (+7.0 search, +4.8 arrivals), Croatia (−8.7, −2.4), Turkey (−6.2, −8.5) and Malta (+21.1 search against a +46% arrivals year in 2025). The one miss is Portugal. Four of five corridors directionally aligned — against two of six in the UK.
The newest major source market in the Mediterranean is the last one where the search box still works. The pattern fits the mechanism: markets in their growth phase are full of first-time buyers, and first-time buyers research. Mature markets run on repeat visits, brand apps, direct relationships — and, increasingly, on channels that never touch a results page. Britain didn't stop wanting Greece. Britain stopped asking Google about it.
What hoteliers should do with search demand data
Search data is not dead — it is demoted. Five working rules from this grid.
Stop reading search volume as market demand. The days when a destination's search curve proxied its bookings curve are over. If your board deck still shows search trend as the demand slide, it told you Greece was collapsing in the year Greece grew 36% from its biggest market.
Read position, not volume. Within a shrinking surface, share still matters — Cyprus falling 30% in UK search while Malta falls 12% is a real share loss inside the decline, and it matched the seats and arrivals ledgers. Relative movement survives the instrument's decay; absolute movement doesn't.
Treat agreement as confirmation, divergence as a channel question. Where search and arrivals fall together, you have a genuine demand problem. Where search falls and arrivals hold, you have a visibility migration — your guests are still coming, but they are deciding somewhere you may not be present. That somewhere is the subject of a later reading.
Keep the clock, retire the gauge. The search curve's shape remains a valid timing signal — when your markets start looking is still when they start booking, one month ahead of arrival. Use it to time campaigns and rate decisions. Just stop using its height to size the demand.
Watch Poland in the old instrument, everyone else in the new ones. For the one market still researching in the search box, search remains a usable leading signal — and the Polish cells of this grid (Malta, Italy, Cyprus rising) are exactly where Polish capacity and arrivals are flowing.
The next reading stays inside the search box one last time, for the one thing it can still do: tell you how each market thinks.
Reading 5 · Next
What each country types when it dreams of the Mediterranean
Poles type all-inclusive, Brits type villas, Germans type beaches — the same destination is a different product in every language.
Read itReading 3
How full is the prophecy flying?
Route conversion — the metric the airlines steer by, and the number that decides Cyprus's October.
Read itReading 1
The Mediterranean Pulse: The Board
The full region on one page — the airline schedule and the arrivals record, in a shape that repeats every edition.
Read itReading 2
The Cyprus October gamble
Airlines cut the island's August and bet big on October. What that reveals about how hotel demand now works.
Read it