Research
Summer 2026: Who Won and Lost in the Mediterranean
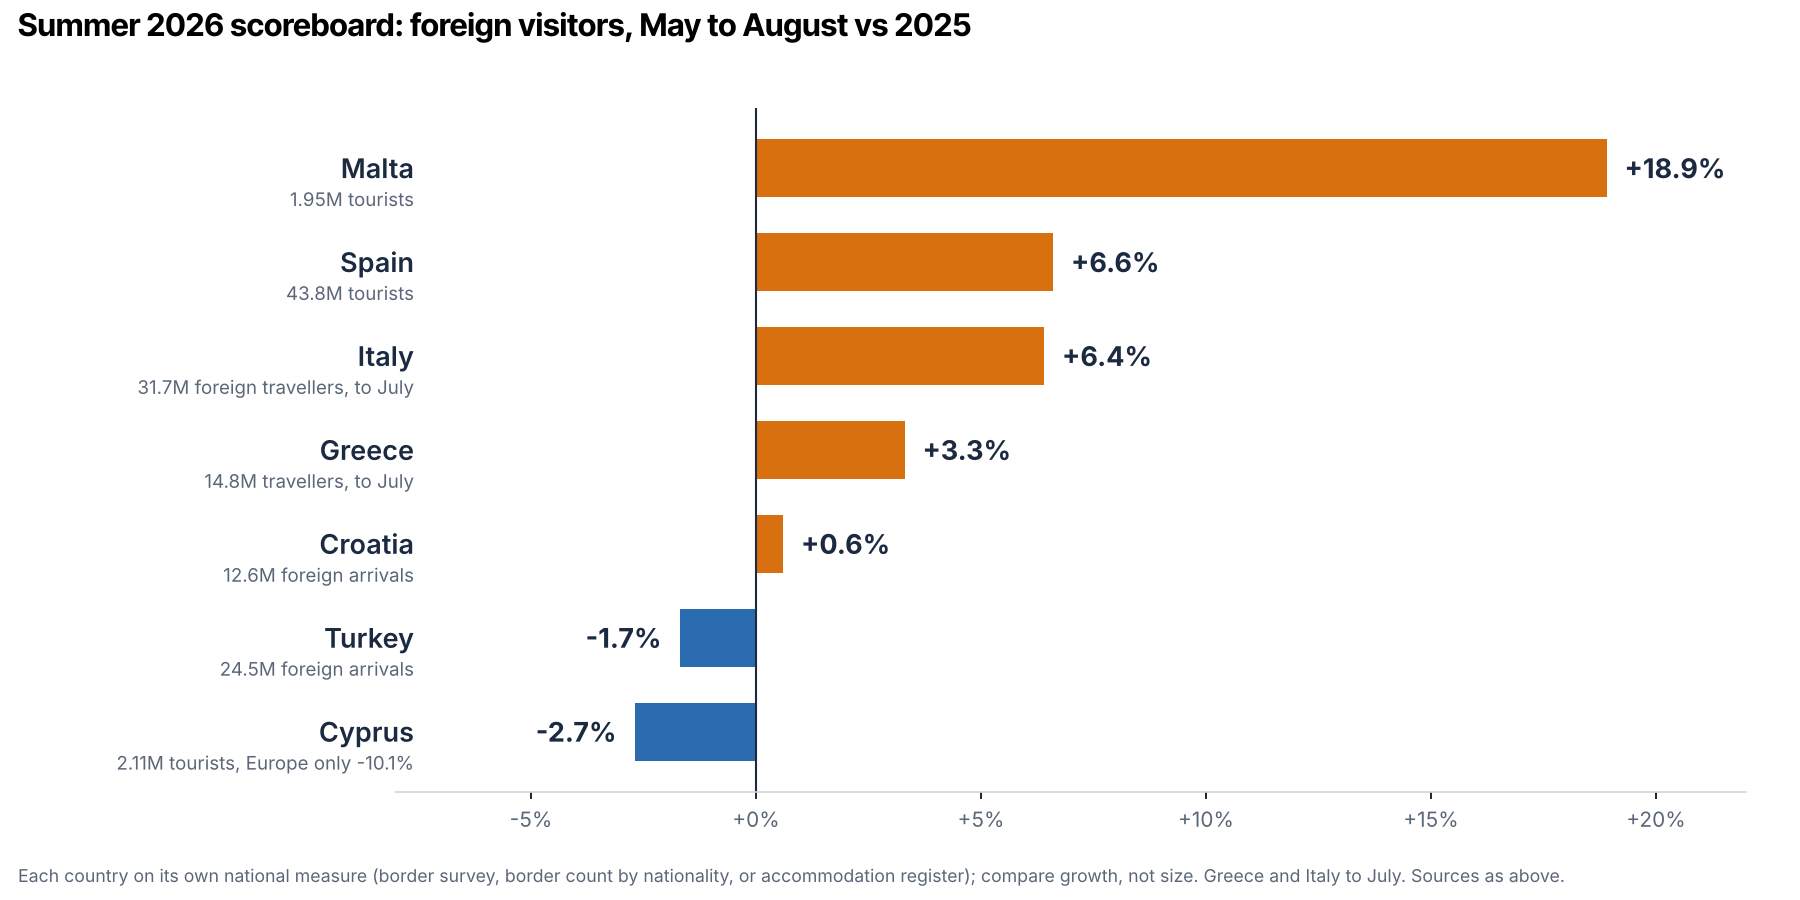
Seven Mediterranean destinations, May to August 2026: Malta, Spain and Italy grew, Cyprus and Turkey fell. Where the British and Germans went instead.

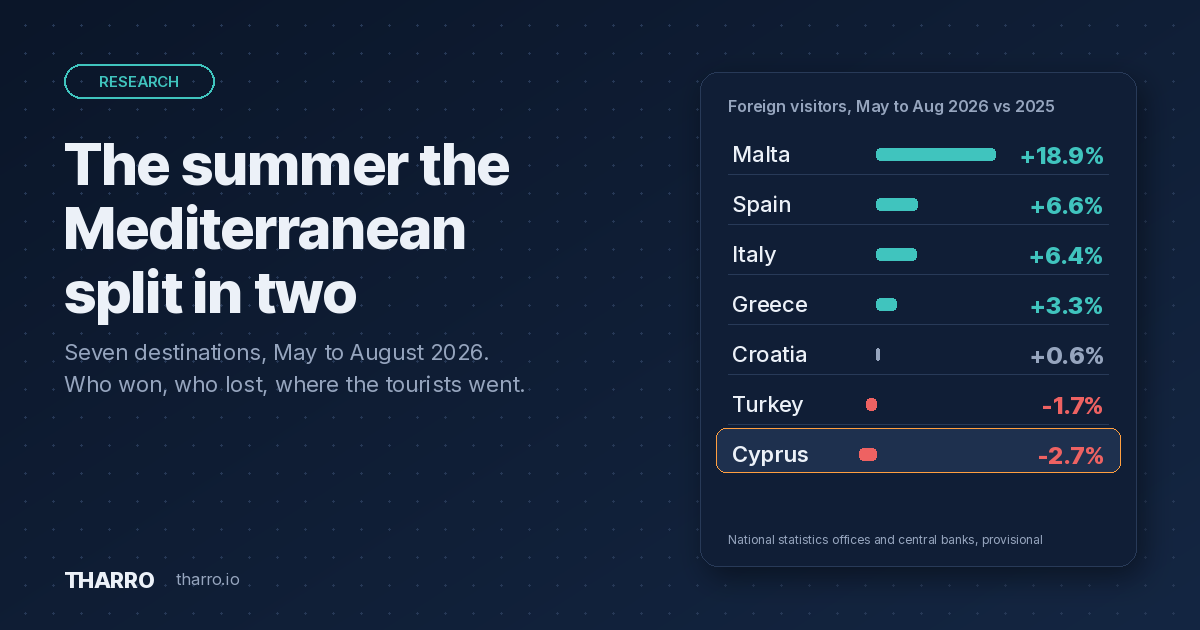
Every national statistics office publishes its own summer. Hoteliers read their own country's number, compare it with last year, and move on. Put seven of those numbers side by side and a different picture appears: summer 2026 was not a good or a bad season for the Mediterranean. It was two seasons happening at the same time.
Spain, Italy, Malta and (more modestly) Greece grew. Croatia stood still. Cyprus and Turkey shrank. And underneath the national totals, the same source markets kept showing up in the winners' columns and disappearing from the losers'. The tourists did not stay home. They moved.
1. The scoreboard
| Destination | May to Aug 2026 | vs 2025 | What is counted |
|---|---|---|---|
| Malta | 1.95M tourists | +18.9% | Border survey, by residence |
| Spain | 43.8M tourists | +6.6% | Border survey (FRONTUR), by residence |
| Italy | 31.7M foreign travellers (May to Jul) | +6.4% | Bank of Italy border survey* |
| Greece | 14.8M travellers (May to Jul) | +3.3% | Bank of Greece border survey* |
| Croatia | 12.6M foreign arrivals | +0.6% | Commercial accommodation, non-residents (nights +0.1%) |
| Turkey | 24.5M foreign arrivals | -1.7% | Border, by nationality |
| Cyprus | 2.11M tourists | -2.7% | Border survey, by residence (Europe only: -10.1%) |
*Greece and Italy publish their border surveys later than the others; airport traffic through August points the same way (Greece international air arrivals +2.7%, Italy international air passengers +6.8%, May to August). Airport counts are not visitor counts, so they are not shown as volumes.
Each country counts its visitors its own way, so the table compares growth, not size. On growth the split is clear: the west and Malta grew, the east did not.
One number deserves a second look. Cyprus's -2.7% hides a European collapse of -10.1%, papered over by a single market, Israel, up 51%.
2. Where the tourists went
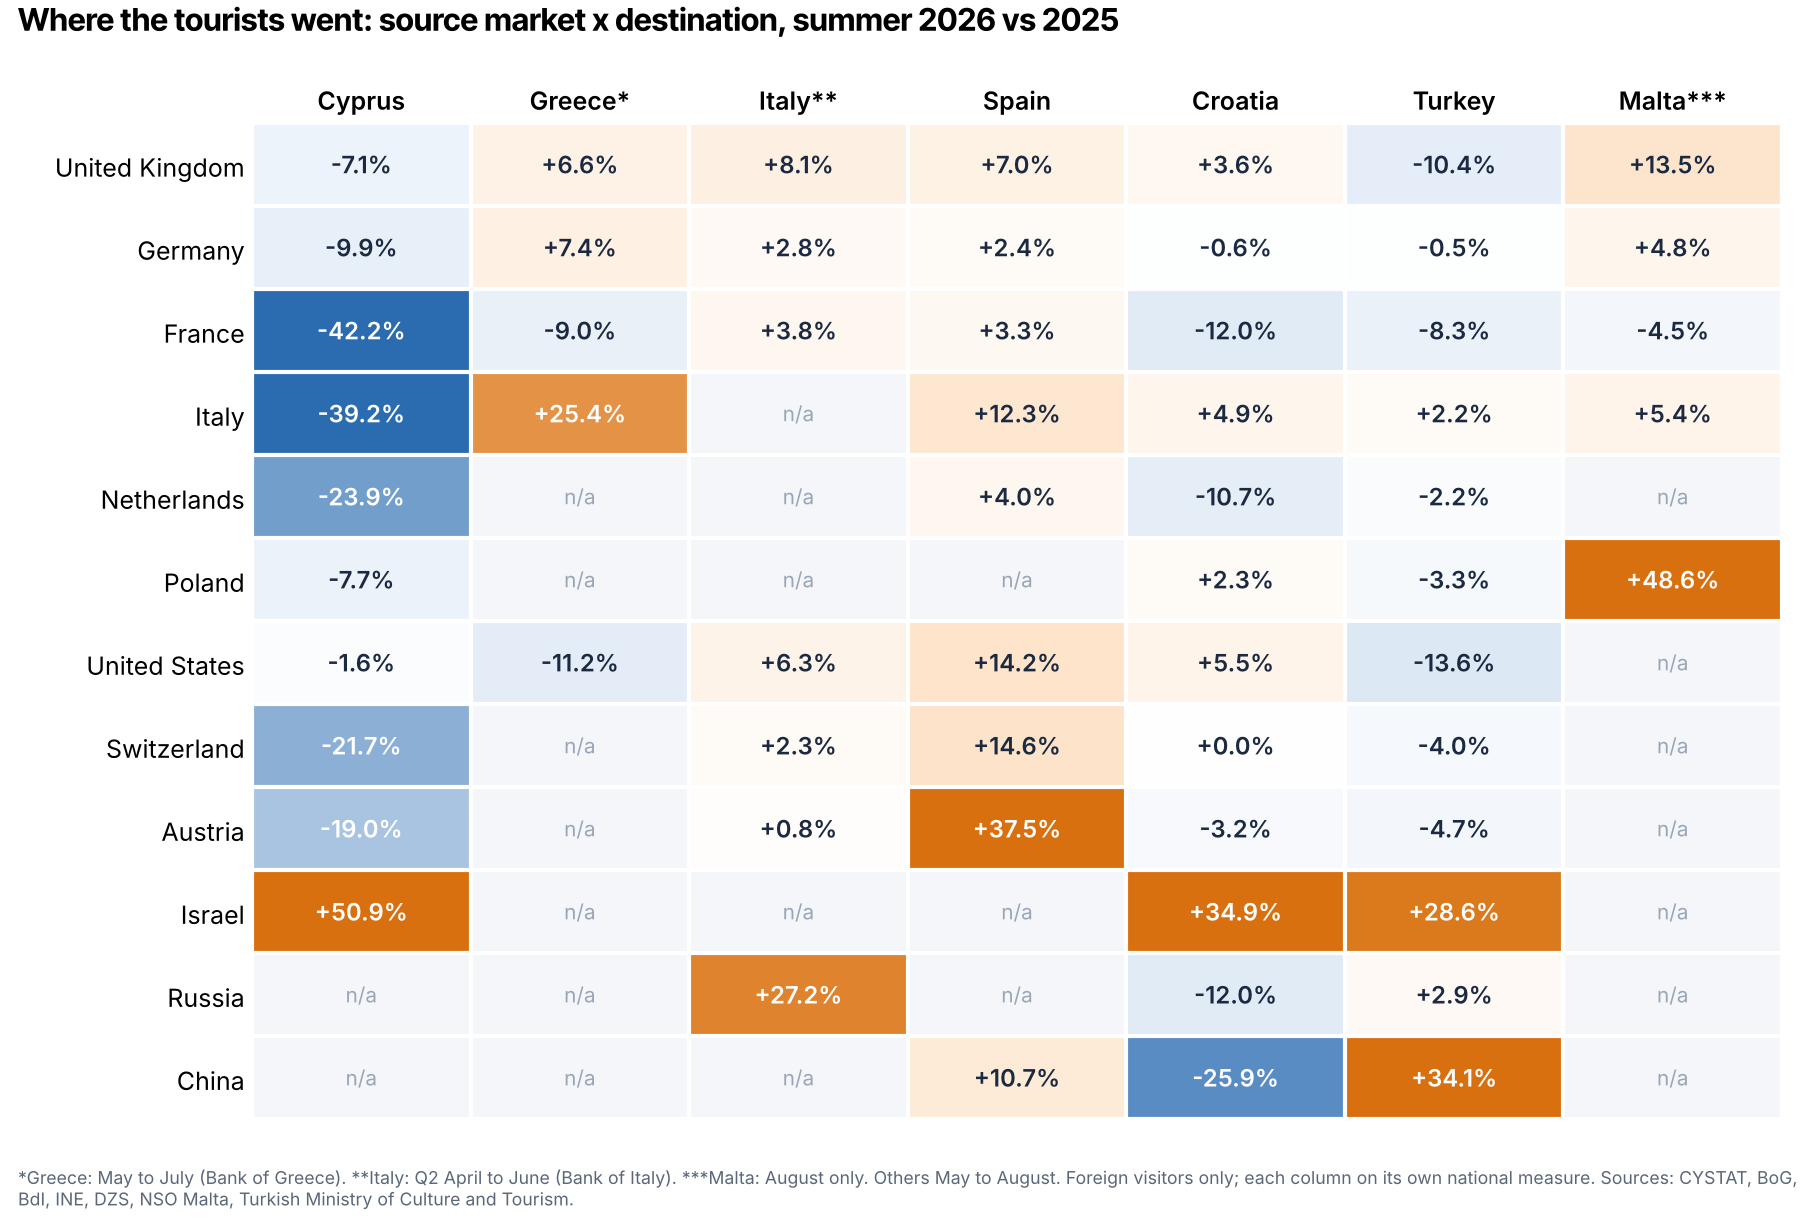
This is the table most hoteliers never see, because nobody publishes it. Each row is a source market; each column is what that market did in that destination.
| Market | Cyprus | Greece* | Italy** | Spain | Croatia | Turkey | Malta*** |
|---|---|---|---|---|---|---|---|
| United Kingdom | -7.1% | +6.6% | +8.1% | +7.0% | +3.6% | -10.4% | +13.5% |
| Germany | -9.9% | +7.4% | +2.8% | +2.4% | -0.6% | -0.5% | +4.8% |
| France | -42.2% | -9.0% | +3.8% | +3.3% | -12.0% | -8.3% | -4.5% |
| Italy | -39.2% | +25.4% | n/a | +12.3% | +4.9% | +2.2% | +5.4% |
| Netherlands | -23.9% | n/a | n/a | +4.0% | -10.7% | -2.2% | n/a |
| Poland | -7.7% | n/a | n/a | n/a | +2.3% | -3.3% | +48.6% |
| United States | -1.6% | -11.2% | +6.3% | +14.2% | +5.5% | -13.6% | n/a |
| Switzerland | -21.7% | n/a | +2.3% | +14.6% | 0.0% | -4.0% | n/a |
| Austria | -19.0% | n/a | +0.8% | +37.5% | -3.2% | -4.7% | n/a |
| Israel | +50.9% | n/a | n/a | n/a | +34.9% | +28.6% | n/a |
| Russia | n/a | n/a | +27.2% | n/a | -12.0% | +2.9% | n/a |
| China | n/a | n/a | n/a | +10.7% | -25.9% | +34.1% | n/a |
*Greece: Bank of Greece survey, May to July; August lands on 25 October. **Italy: Bank of Italy publishes the market split quarterly; Q2 (April to June) shown, Q3 due in December. ***Malta: August only by market (Jan to Aug: UK +17.9%, Poland +50%, Italy +9.5%, Germany +8.2%, France -7.2%).
Read it by row and the stories write themselves.
The British went west. Down 10% in Turkey and 7% in Cyprus, up 7% in Spain and Greece, 8% in Italy, 13% in Malta. The UK is the largest market for both Cyprus and Turkey; it is the one market whose redistribution alone explains most of the east's shortfall.
Germany stayed put, except in Greece. Flat in Croatia and Turkey, +2% to +3% in Spain and Italy; up 7% in Greece; down 10% in Cyprus. German volume did not grow this summer. It rotated.
France retreated everywhere but Spain. Negative in six of seven destinations, including a 42% drop into Cyprus and 12% into Croatia.
Italians had a big year abroad. Up 25% into Greece, 12% into Spain, 5% into Croatia and Malta. Only Cyprus lost them (-39%).
Americans chose Spain. Up 14% there, 6% in Italy, 5% in Croatia; down 11% in Greece and 14% in Turkey. The dollar bought a different Mediterranean this year.
The east found new customers. Israel is the story in Cyprus (+51%), but also in Croatia (+35%) and Turkey (+29%). Turkey's shortfall from Western Europe was partly filled by Iran (+24%) and China (+34%); Russia, Turkey's largest market, grew 3%.
The pattern is consistent: Spain is positive in nearly every row; Cyprus is negative in nearly every European row; Turkey loses the West and gains the East.
3. Winners inside the winners: the regions
Growth was not spread evenly inside the growing countries either. It went to cities, second-tier regions, the South and the smaller islands. The mature beach destinations were flat.
Spain. Murcia +21%, Madrid +14%, Andalucía +13%, Valencia +9%, Catalonia +6%. The two island systems that carry Spain's summer brand barely moved: Balearics +2%, Canaries -1.3%.
Greece (international air arrivals, May to Aug). Samos +19%, Skiathos +13%, Kefalonia +11%, Karpathos +10%, Mykonos +10%, Chania +9%, Thessaloniki +7%, Corfu +7%, Heraklion and Rhodes +4%. Kos 0.0%, Santorini -0.1%. Athens -5.4%: the capital lost 220,000 international air arrivals over four months while the regional airports gained 670,000.
Italy (international air passengers, May to Aug). Calabria +33%, Abruzzo +27%, Puglia +20%, Sardinia +19%, Sicily +15%, Veneto +8%, Campania +7%; Lombardy +4%, Lazio +2%. Palermo +33%, Bari +19%, Olbia +14%, Venice +10%, Naples +9%; Rome Fiumicino +2%, Malpensa +2%, Catania flat for the summer and -23% in August after the airport's disruption. The South and the islands grew; the two hubs did not.
Croatia (foreign arrivals). Istria +1.6%, Dubrovnik +0.9%, Split-Dalmatia +0.7%, Kvarner +0.6%, Zadar -0.6%, Šibenik -0.3%, Zagreb -1.8%. A country where nothing moved, and three coastal counties turn negative once Croatian guests are excluded.
Cyprus. On the full market mix, Limassol +3.6% and Larnaca +2.1% look fine; Famagusta -6.5%, Paphos -0.6%. Strip out Israel and every area is between -7% and -14%. Israeli demand concentrated in Limassol and Larnaca; British and German demand fell across the island.
Turkey (by province of entry). Antalya -5.2%, Muğla -5.7%, İzmir -2.6%, Aydın -7.6%. Istanbul +1.5%. The resort coast took the hit; the city did not.
Malta. Tourists visiting Gozo and Comino +9% in August and +14% January to August, in line with the national total. Gozo hotel arrivals +14% May to July (this register includes Maltese residents).
4. Volume is not value
Arrivals are the headline; receipts are the business. Where both exist, the gap widened.
- Greece, June: UK arrivals -12%, UK receipts -26%. Spend per British trip fell 16%. Italian receipts +34% on +22% arrivals; French receipts -34% on -19% arrivals.
- Malta, January to August: tourists +17.9%, expenditure +15.6%. Spend per head €937, down from €956. Nights +10.9%, so stays got shorter as well as cheaper.
- Croatia, May to August: foreign arrivals +0.6%, foreign nights +0.1%. Shorter stays. Germany, the largest market, -1.7% in nights on -1.0% in arrivals January to August.
- Cyprus, July: arrivals -1.1%, revenue €536.5M, up on the year. Fewer people, higher spend, carried by the Israeli mix.
Three of the four growing destinations grew their arrivals faster than their income. The one shrinking destination with data grew its income on falling arrivals.
5. What this means if you run a hotel
The season's data supports five practical readings.
Your market did not disappear. It went somewhere, and that somewhere is knowable. A Paphos hotel that lost British guests this summer was not competing with Larnaca. It was competing with Andalucía (+13%) and Malta (+13.5%). Source-market planning that stops at the national border misses the competitor that actually took the booking. This is the gap source-market analysis is meant to close, and why demand intelligence has to track origin markets across destinations, not inside one.
One rescue market is a dependency, not a strategy. Cyprus without Israel is 10% down. Turkey's European arrivals fell 4.6%; without Russia and Iran the country is -3.8%, not -1.7%. A market that delivers +50% in one summer can deliver -50% in the next, as Russia did in Cyprus. The mix that saved 2026 is the risk of 2027.
Growth is leaving the brand-name beaches. Balearics, Canaries, Kos, Santorini, Istria, Antalya, Rome, Milan: flat or up low single digits. Murcia, Madrid, Thessaloniki, Samos, Skiathos, Puglia, Sardinia, Sicily, Gozo: up double digits. Demand is finding the places that are cheaper, less crowded and newly connected by air. If you are in a mature resort, the flat number is not a bad summer; it is a ceiling.
Length of stay is falling. Malta grew arrivals faster than nights, and Croatia's flat foreign arrivals came with flatter nights. More arrivals with shorter stays means more turnover cost per occupied night and more pressure on the booking window. The guest count went up; the guest did not stay.
The recovery is a September question now. August was flat to slightly negative in Cyprus (-3.3%), Turkey (0.0%) and Croatia (foreign arrivals +1.6%, nights 0.0%). The west's growth was front-loaded: May was the strongest month in Spain (+9.5%) and Croatia (+9.1%). Whether the east's autumn and the west's shoulder season hold is the number to watch next, and the reason search demand runs ahead of arrivals matters more in a season like this one.
Method and sources
Window: May to August 2026 versus May to August 2025, except where a source publishes later (Greece and Italy border surveys to July, Italy markets Q2; Malta markets August only). Airport figures (Greece: international arrivals; Italy: international passengers, both directions) are used only as year-on-year indicators and for the regional split, never as visitor volumes. Sources: CYSTAT (Cyprus), Bank of Greece and INSETE/CAA (Greece), Banca d'Italia and Assaeroporti (Italy), INE FRONTUR (Spain), DZS (Croatia), NSO Malta, Turkish Ministry of Culture and Tourism border statistics. All figures are foreign visitors only; residents are excluded everywhere (Croatia's domestic guests are reported separately). Measures differ by country: Cyprus, Spain, Malta, Italy and Greece count non-residents at the border by country of residence; Turkey by nationality; Croatia counts non-resident guests in commercial accommodation, so a guest who moves between two Croatian towns is counted twice. Countries are ranked on their own year-on-year change only. Cyprus regional figures are estimates from the national series and the 2025 location-of-stay survey, on 22 markets reported every month in both years. Turkish provinces are by province of entry. Kalamata airport excluded from Greek totals (August not published). All 2026 figures are provisional.
FAQ
Which destinations won summer 2026? On foreign visitors for May to August 2026 against the same months of 2025, Malta (+18.9%), Spain (+6.6%), Italy (+6.4%, to July) and Greece (+3.3%, to July) grew. Croatia was flat (+0.6%). Turkey (-1.7%) and Cyprus (-2.7%) fell.
Where did British tourists go in summer 2026? British arrivals fell 10.4% in Turkey and 7.1% in Cyprus, and rose 7.0% in Spain, 6.6% in Greece, 8.1% in Italy (Q2) and 13.5% in Malta (August). The UK is the largest market for both Cyprus and Turkey, so this one shift explains most of the east's shortfall.
Why is Cyprus down when Israeli arrivals are up 51%? Because Israel is one market. Across Cyprus's European markets, arrivals fell 10.1%: UK -7%, Germany -10%, France -42%, Italy -39%, Netherlands -24%, Switzerland -22%, Austria -19%. Israel filled part of the gap, not all of it, and concentrated in Limassol and Larnaca.
Can the seven countries be compared directly? Only on growth. Each counts foreign visitors with its own method: border surveys by country of residence in Spain, Italy, Greece, Cyprus and Malta; border counts by nationality in Turkey; non-resident guests in commercial accommodation in Croatia. Levels are not comparable, year-on-year change is.
Track your own source markets against the destinations that compete for them. See how demand intelligence works or start a free trial.